There are five metrics that you should check before buying a dividend stock.
Especially any high dividend stocks with a consistent payout.
These metrics will help you screen companies before you commit and empower you to make wise, profitable decisions.
There are plenty of online tools that will help you look up these metrics about any given dividend paying stock.
Interpreting the data, however, is a challenge in itself.
That’s why, starting with the basics, I’ve compiled a list of the five metrics to check before buying a dividend stock.
Let’s take a look at what these metrics are, where they come from and what they mean for practical, profitable investing.
Metric 1: Dividends Per Share
Dividends per share is the first and most fundamental of the dividend metrics. When a company decides to reward its shareholders by distributing a dividend, it sets aside a specific amount of a company’s money for every outstanding share, or dividends per share. For every share of the company you own, you’ll receive a payout equal to the dividends per share multiplied by however many shares are in your portfolio.
Take the dividends per share of 3M (NYSE:MMM) as an example:
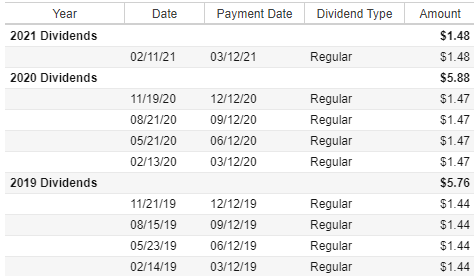
While there are dividends that payout annually or monthly, the vast majority of dividend payers distribute on a quarterly basis. In 2020, 3M paid a dividend per share of $1.47 every quarter, meaning for every share of MMM you owned, you would have received $5.88 by year’s end.
For example, let’s say you owned 100 shares of MMM. In 2020 alone, the company would have paid you $588.00 in dividend distributions.
Metric 2: Dividend Yield
A $588.00 check just for owning some stock sounds nice until you realize that 100 shares of 3M, at their current price, cost $18,466.00. That’s where dividend yield comes in, which effectively measures the efficiency of your investment — dividend yield tells you how much you can expect to be paid relative to the amount of money you invest.
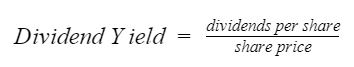
To find the dividend yield, we use the following formula:
Let’s use 3M as an example again.
Looking back to the data table above, we see that 3M pays a dividend of $1.48 per share per quarter, equivalent to an annual dividend of $5.92 per share. We divide that number by the current share price, $184.19 (as of March 11, 2021), and get:
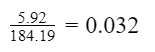
So 3M has a forward dividend yield of 3.2%, meaning for every $100 you invest in the company, you’ll receive a dividend distribution of $3.20.
However, many investors stop there, thinking that in order to make the best investments, they need only find the stocks with the highest dividend yields!
Not so fast.
A closer look at the formula shows us that two things will make the dividend yield larger: high dividend distributions — which are good — but also falling share prices. Many high-yielding companies are those that may have paid a fair dividend in the last year but since then have seen their stock price plummet. If a share price changes suddenly, it may take several months for the financial defeat to be reflected in historical dividends. A company may have paid a nice dividend three months ago, but if it went belly-up since then, the dividend yield will appear unnaturally high.
Dividend yield is an important metric, but it’s for this reason that it cannot stand alone. To evaluate the actual performance of a company as a dividend payer, we need to look past high yields and evaluate a company’s fundamentals.
See the other metrics on DividendInvestor.com


Leave a Comment